 The newest Pew Research report on libraries is out. As usual, it’s filled with some great, useful statistics and insights about how Americans are using their public libraries.
Here are some highlights that stood out to me:
- 80% of Americans think public libraries should definitely offer programs that teach digital skills.
- 57% think we should have more comfortable spaces for reading, working and relaxing.
- 50% think libraries should buy 3D printers and other digital tools.
- Moving some print books and shelves out of public spaces to free up space for tech centers, reading rooms, meeting rooms, etc … 24% said definitely yes, and 40% said “maybe.” – So that’s 64% of people that think we should at least consider our options. To me, that means if we make an educated, informed decision … it will be ok!
- “There is also a growing sense that libraries can help people decide what information they can trust: 37% of Americans feel that public libraries contribute “a lot” in this regard, a 13-point increase from a survey conducted at a similar point in 2015.” – Sounds like there’s still a lot of work to be done here!
- There was a four-point drop … in the number who visited library websites in the previous 12 months – falling from 31% who said they’d done so in 2015 to 27% in 2016. – Not at my library (use of our website is up).
- 7% of those 16 and older say they have connected to a library’s Wi-Fi system when the library building itself was closed.
- 44% of those 16 and older say their public libraries loan out e-books, while 10% say this is not true of their communities’ libraries. Researchers at the University of Maryland report that 90% of libraries have e-book lending programs. – We haven’t yet figured out how to promote our non-print-book stuff.
- Use of mobile apps to access library resources is not too common among Americans: 8% said they had used public library mobile apps in the past year, compared with 12% who said they had done this in 2015. – Interesting. I’m still convinced that a mobile-friendly website is the better way to go. And it’s backed up by some research.
Make sure to read the report, and think about how your library matches up. If you don’t like something you see here … how are you going to change it? Schedule that planning meeting and figure it out!
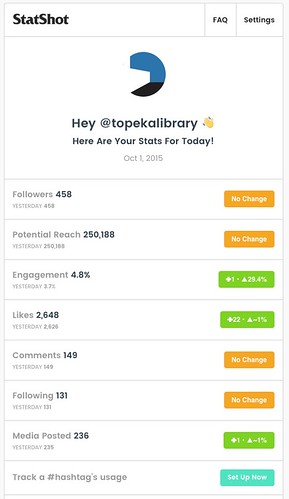 I recently discovered a cool tool for tracking Instagram analytics. It’s called
  I’m often asked “how often should we post to Facebook/Twitter/Instagram/etc.?” I pretty much always say the same thing (I’ll give my response in a sec).
 In this series of articles, I’ve been talking about what types of social media analytics my library tracks.
 In this series of articles, I’ve been talking about what types of social media analytics my library tracks. We’ve already discussed Activity Metrics, Audience Metrics, Engagement Metrics, and Referral Metrics. Today we’ll cover ROI.